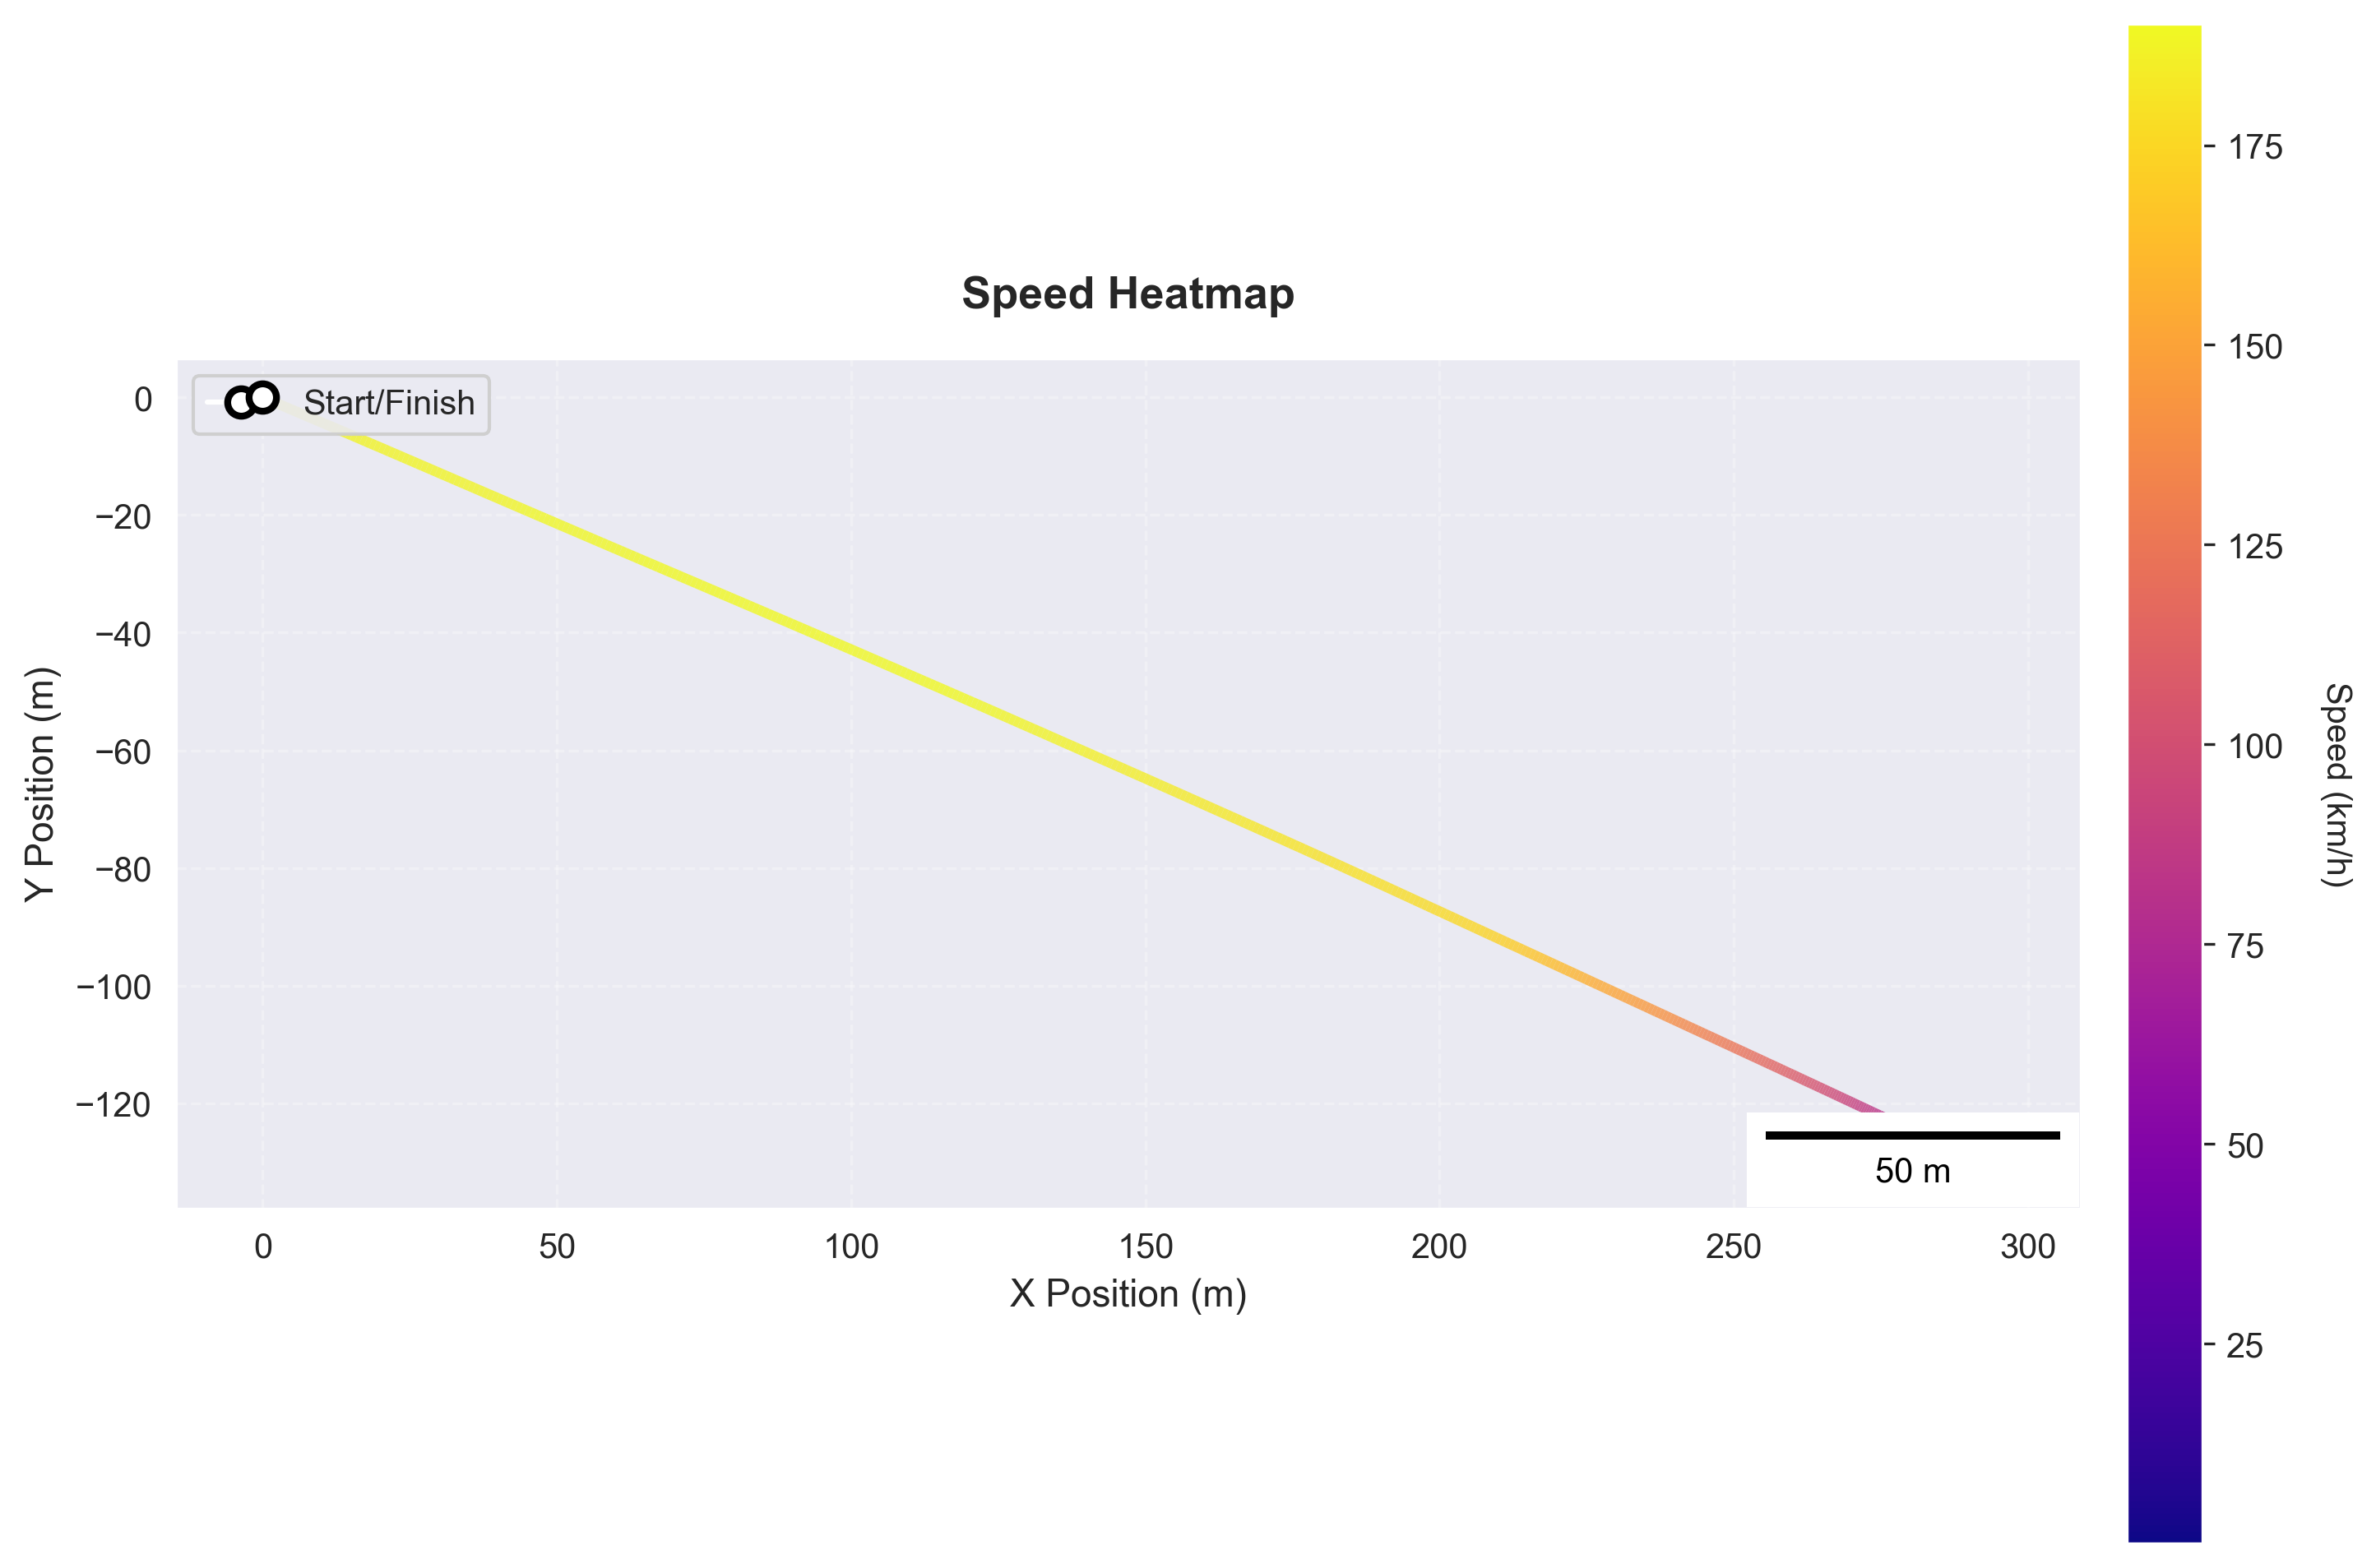
TrackHeatmapAnalyzer - Circuit Session - Lime Rock MX-5
Track heatmap showing speed or other metrics overlaid on track layout
Sample Data
| Attribute | Value |
|---|---|
| Source | garage61 |
| Category | circuit_lap |
| File | 01K451BYJ64G0T2GPQ44AKXC86 |
Available Channels (23): LongAccel, VertAccel, YawRate, abs_active, brake, clutch, distance, drs_active, gear, lap_distance_pct, lat_accel, latitude, longitude, position_type, rpm, speed, steering, throttle, time, track_pct, x, y, yaw
Configuration
| Setting | Value |
|---|---|
| Metadata Only | False |
When to Use
- User asks 'where on track am I fastest/slowest'
- User wants visual speed map of the circuit
- User wants to see racing line colored by performance metric
- User asks to visualize throttle or brake application on track
Key Options
| Option | Description |
|---|---|
lap_selection | best |
value_column | speed |
colormap | viridis |
speed_unit | kph |
Sample Output
Subjects Analyzed: 1
Default
| Property | Value |
|---|---|
| Format | png |
| DPI | 300 |
| Subjects | 1 |
Example Calls
Show me where on track I'm fastest and slowest
analyze(analyzers='track_heatmap', event='01H8SP4HK4', lap_selection='best', value_column='speed')
Creates speed heatmap of best lap with color from slow (blue/purple) to fast (yellow/red)
Visualize my throttle application on the track
analyze(analyzers='track_heatmap', event='01H8SP4HK4', value_column='throttle', colormap='viridis')
Shows throttle position (0-100%) overlaid on track layout
Generated from b4racing.analysis.graphics.track_heatmap.TrackHeatmapAnalyzer